Alert Lifecycle
Every alert in YipYap follows a defined lifecycle. Understanding these states and transitions helps you respond effectively and configure your escalation policies correctly.
Alert States
Section titled “Alert States”| State | Description |
|---|---|
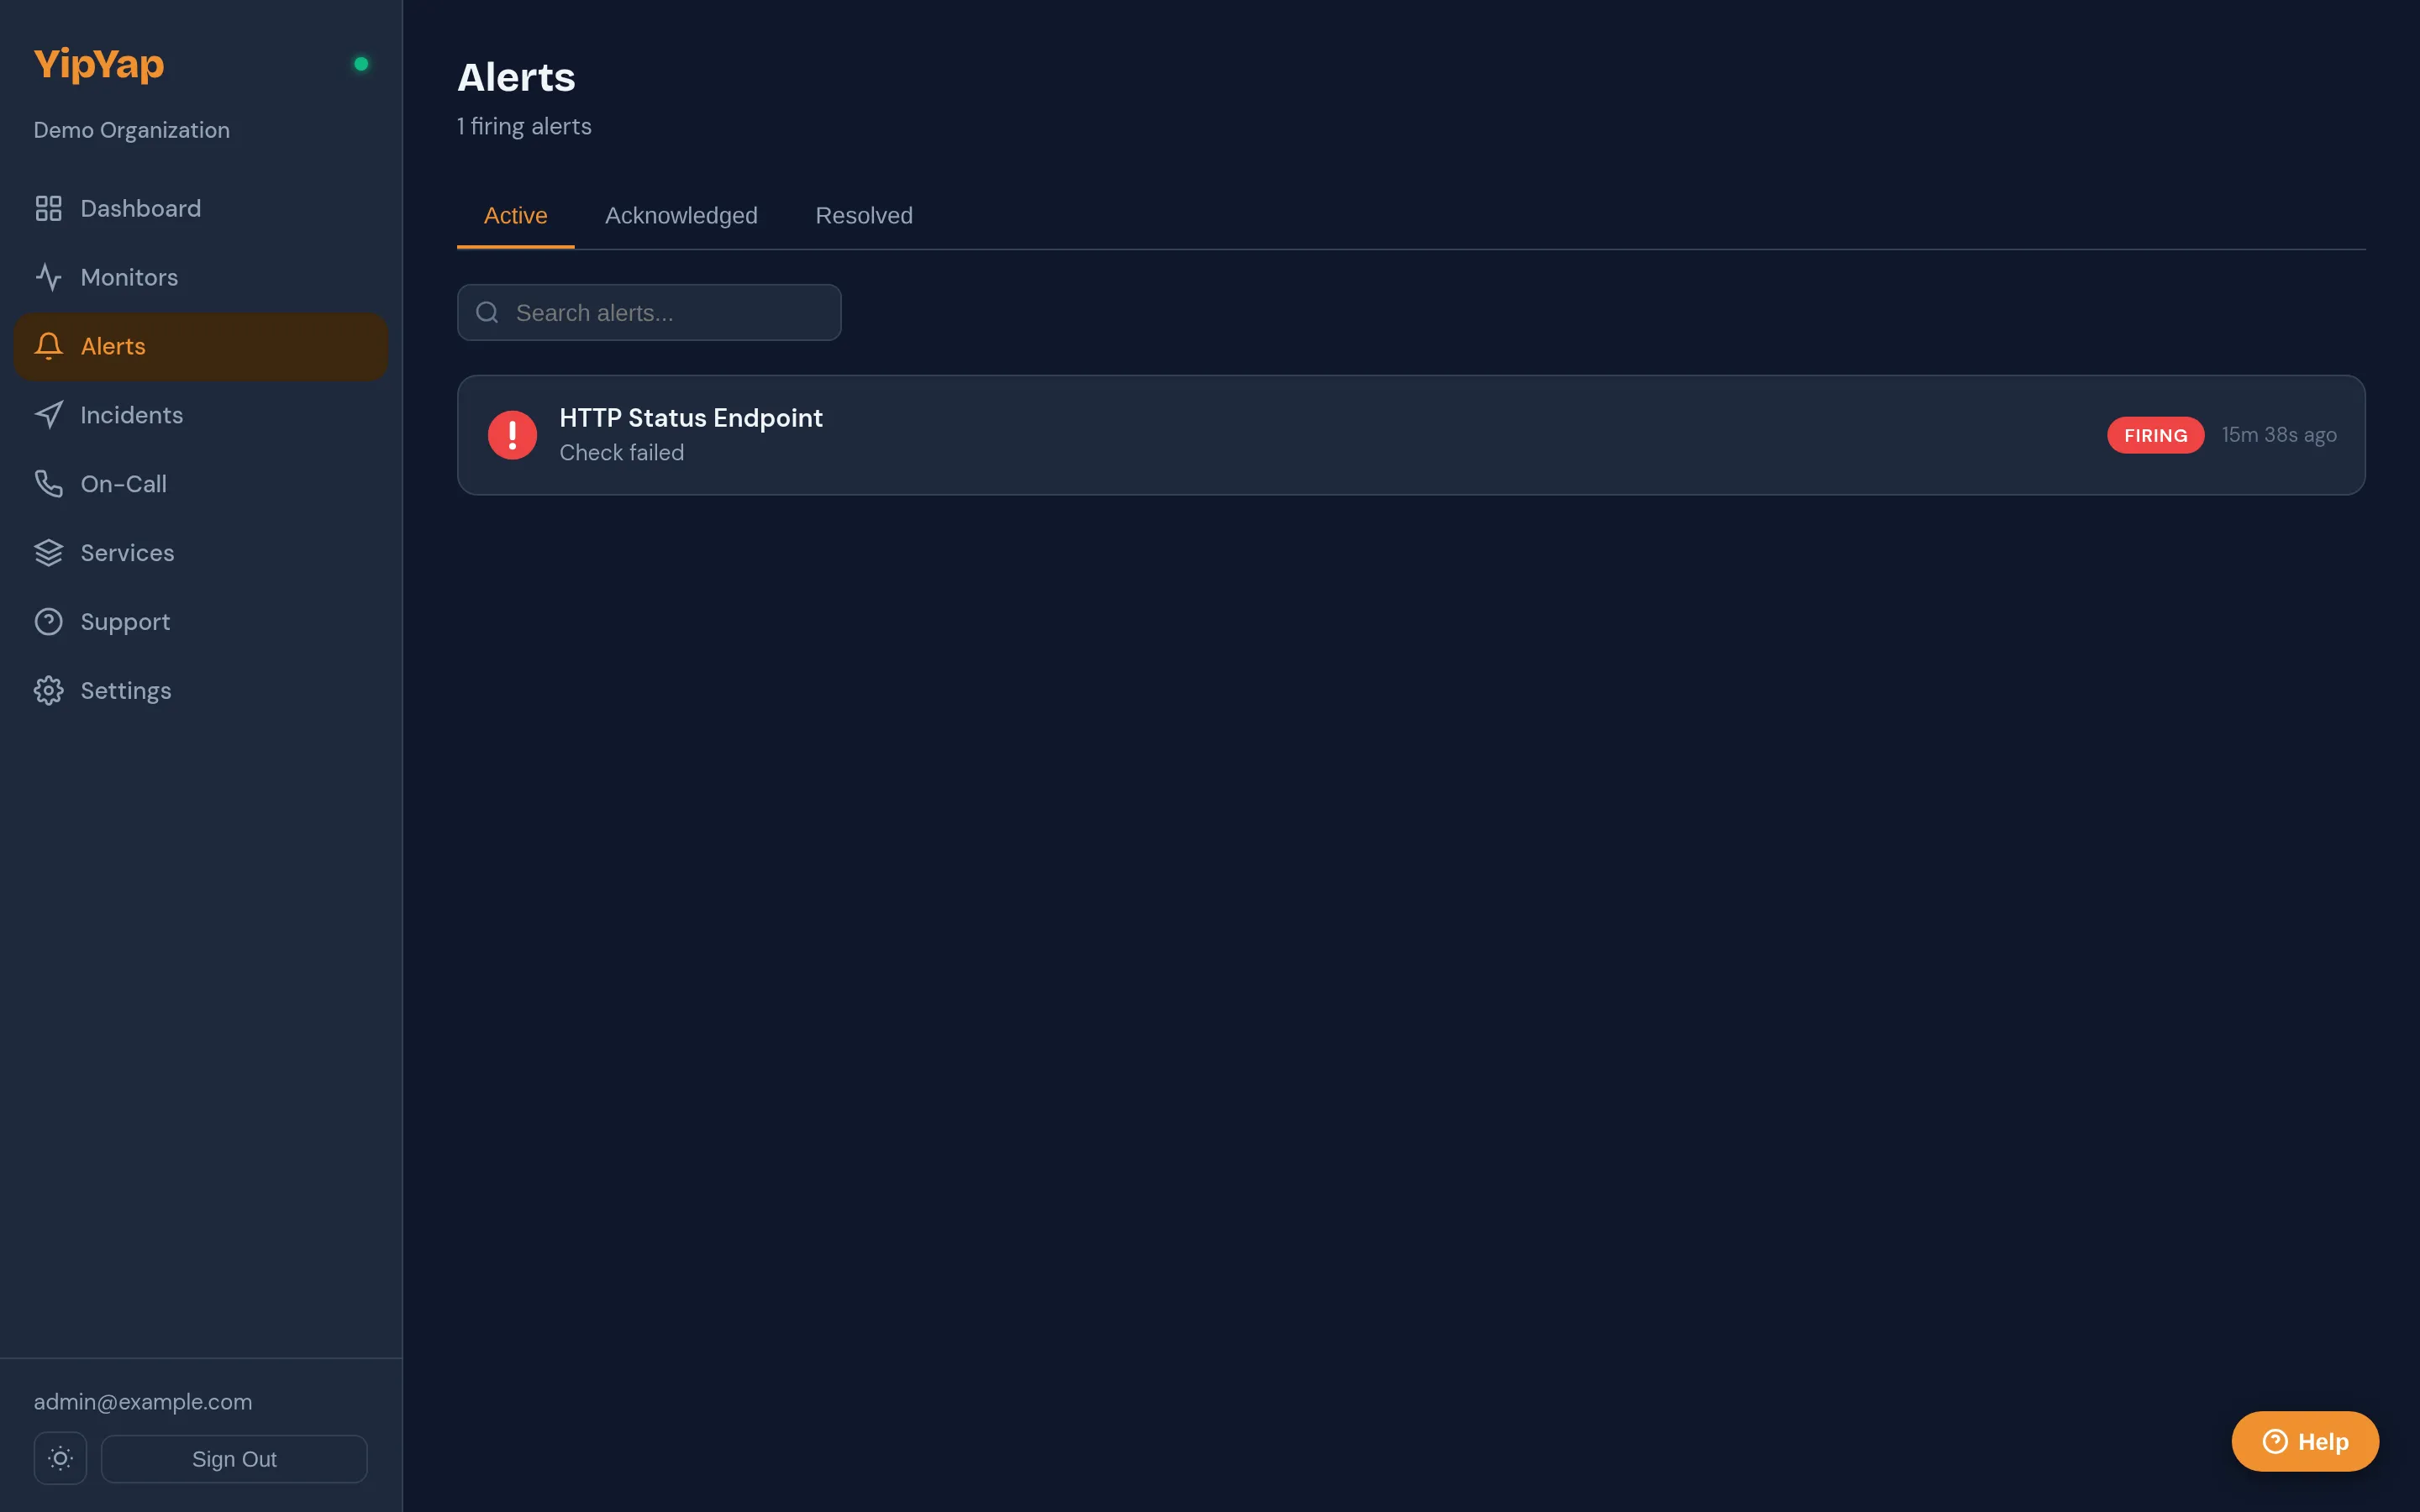
firing | The monitor has confirmed a failure and the alert is active. |
acknowledged | A team member has acknowledged the alert but not yet resolved it. |
resolved | The issue has been fixed and the alert is closed. |
State Transitions
Section titled “State Transitions”Firing
Section titled “Firing”An alert enters the firing state when a monitor’s confirmation threshold is reached. At this point, the escalation policy begins executing its steps.
Acknowledging
Section titled “Acknowledging”When a team member acknowledges an alert, the escalation policy pauses. No further escalation steps run. The alert remains open until it is resolved.
You can acknowledge alerts from:
- The YipYap dashboard.
- Interactive buttons in Slack, Discord, or Telegram notifications.
- The YipYap API.
Resolving
Section titled “Resolving”An alert can be resolved in two ways:
- Manual resolve: A team member clicks the resolve button in the dashboard or a notification.
- Auto-resolve: The monitor recovers (returns to the Up state) and YipYap automatically closes the alert.
Auto-resolve is enabled by default and can be toggled per monitor.
Timestamps
Section titled “Timestamps”Each alert records the following timestamps:
- Fired at: When the alert first entered the
firingstate. - Acknowledged at: When a team member acknowledged the alert.
- Resolved at: When the alert was closed.
Working with Alerts
Section titled “Working with Alerts”- Open the Alerts page from the sidebar to see all active and recent alerts.
- Click on an alert to view its details, including the monitor that fired it, the escalation steps taken, and timestamps.
- Click Acknowledge to pause the escalation policy and signal that you are investigating.
- Once the issue is fixed, click Resolve to close the alert. Alternatively, if auto-resolve is enabled, the alert closes automatically when the monitor recovers.
- Review the alert timeline to see a chronological log of all notifications sent, acknowledgments, and status changes.
Severity Levels
Section titled “Severity Levels”Each alert carries a severity level that indicates its urgency:
| Severity | Label | Description |
|---|---|---|
| SEV1 | critical | Service is down or a critical failure occurred. |
| SEV2 | warning | Degraded performance or a non-critical failure. |
| SEV3 | info | Informational, no immediate action required. |
Severity is displayed on alert cards in the dashboard and included in notification messages. The severity is determined by the monitor’s configured down severity and degraded severity settings.
Alert Rollup Graph
Section titled “Alert Rollup Graph”At the top of the Alerts page, a 7-day alert volume chart shows the number of alerts fired per day. Alongside the chart, you will see aggregate stats for Mean Time to Acknowledge (MTTA) and Mean Time to Resolve (MTTR), giving your team a quick overview of alert response performance over the past week.
Auto-Resolve
Section titled “Auto-Resolve”Monitors with auto-resolve enabled automatically resolve their alerts when the monitor recovers to a healthy state. Auto-resolve is enabled by default and can be toggled per monitor.
Incident Auto-Resolve
Section titled “Incident Auto-Resolve”At the organization level, you can enable automatic incident resolution. When this setting is active, incidents auto-resolve when all linked alerts have recovered. Configure this in Settings > Organization under the incident settings section.
Alert History
Section titled “Alert History”All alerts are retained in the alert history for auditing. You can filter by monitor, state, time range, and who acknowledged or resolved the alert.