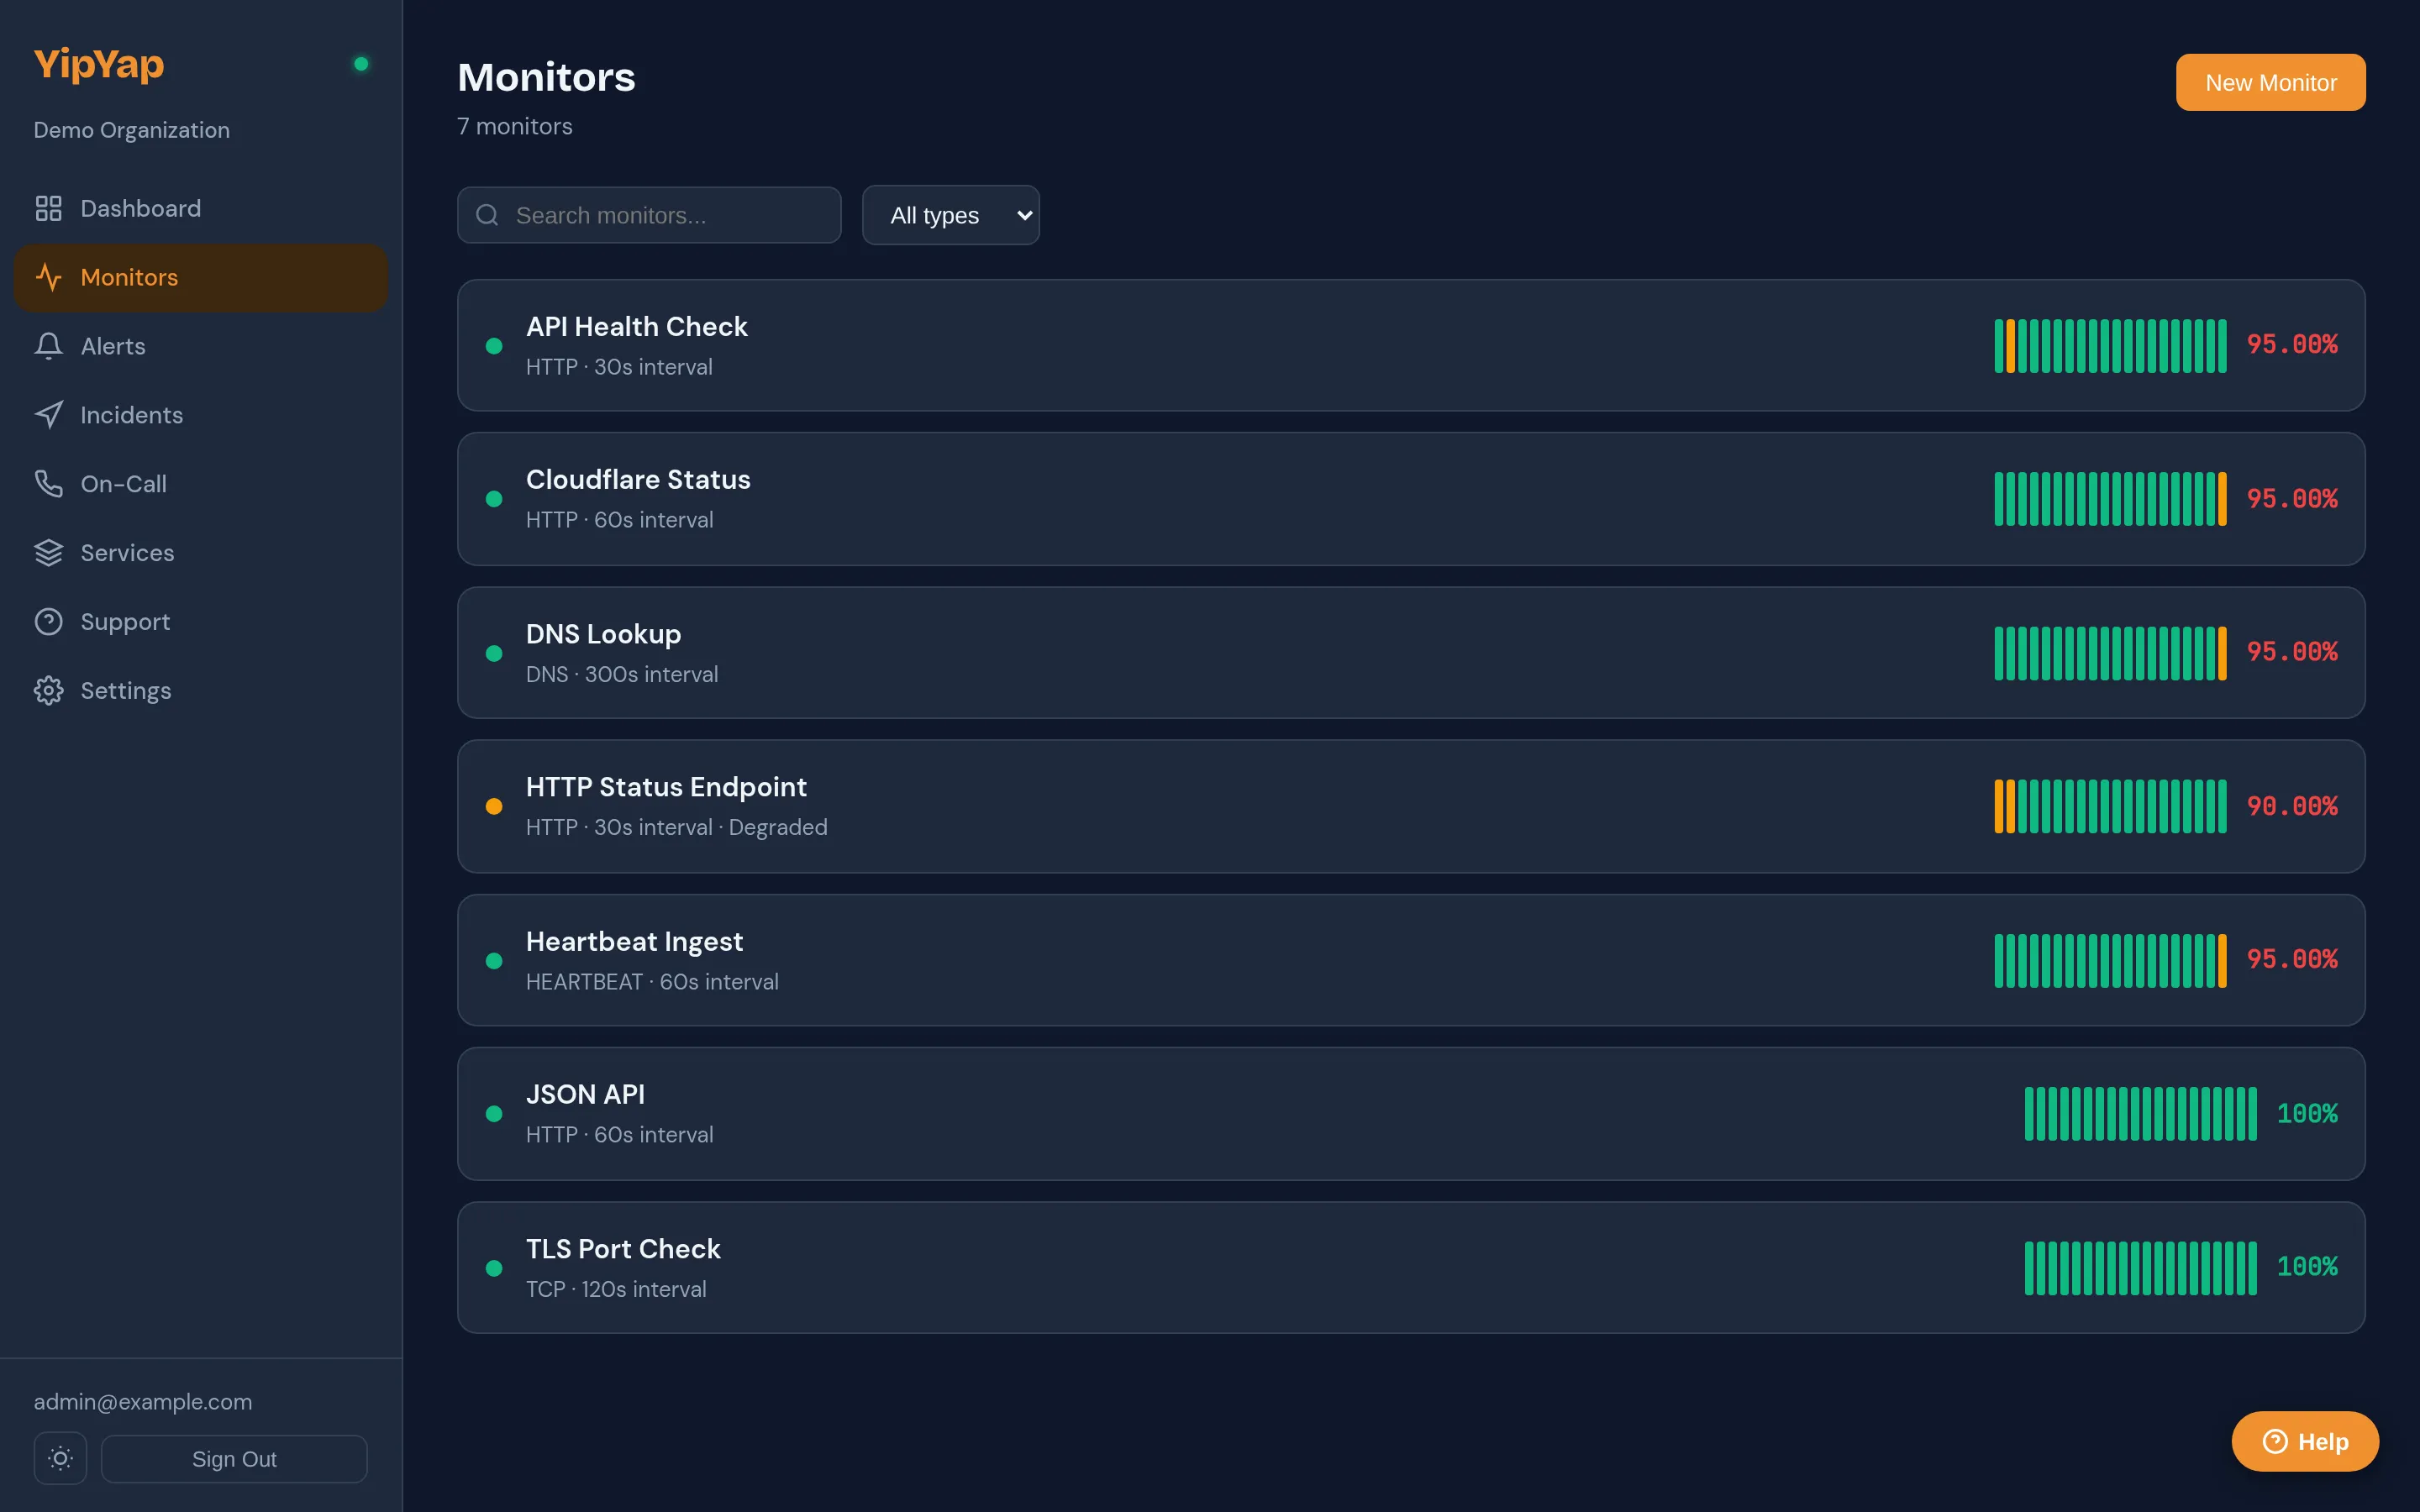
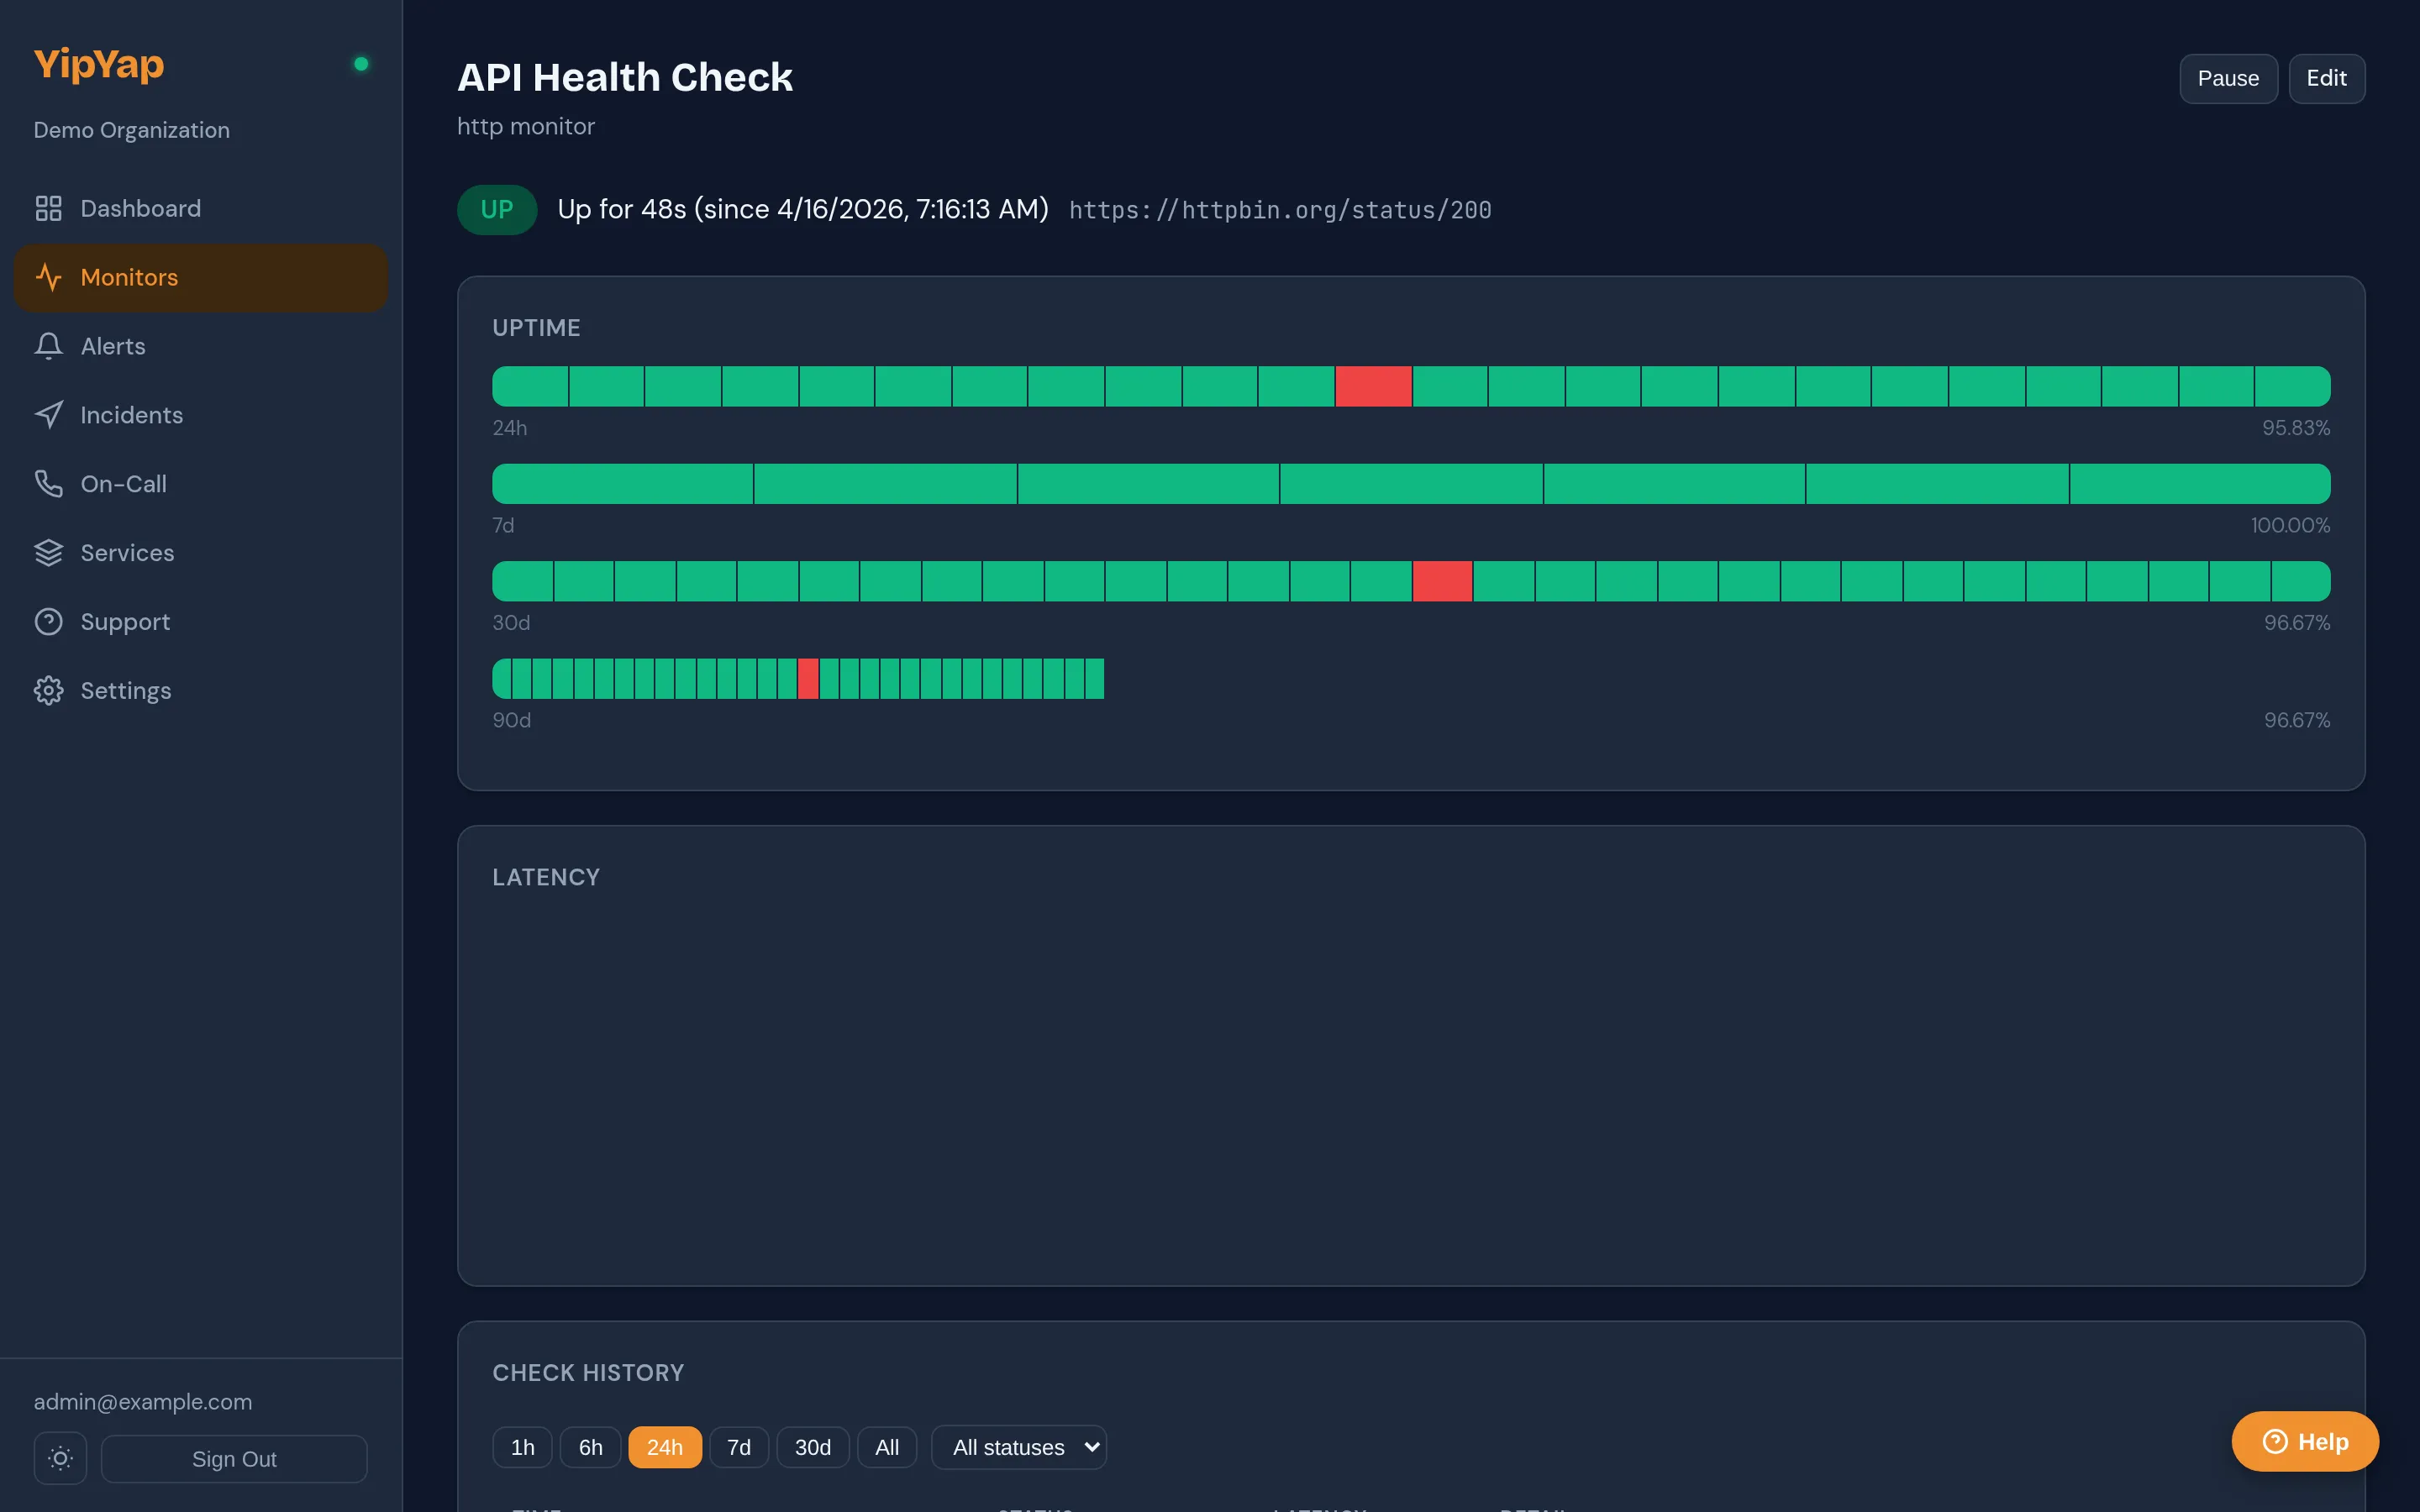
Monitors Overview
Monitors are the foundation of YipYap. Each monitor runs a specific type of check against a service endpoint on a recurring schedule and tracks whether that service is healthy.
Monitor Types
Section titled “Monitor Types”| Type | What It Checks |
|---|---|
| HTTP | URL reachability, status codes, response body |
| TCP | Port connectivity and optional TLS handshake |
| DNS | DNS record resolution and expected values |
| Ping | ICMP reachability and round-trip latency |
| Heartbeat | Receives pings from your service on a schedule |
Common Settings
Section titled “Common Settings”Every monitor shares these configuration options:
- Name: A human-readable label for the monitor.
- Check Interval: How often the check runs (default: 300s / 5 min).
- Timeout: Maximum time to wait for a response before marking the check as failed (default: 10s).
- Latency Warning Threshold (
latency_warning_ms): Latency in ms that triggers a degraded state. - Latency Critical Threshold (
latency_critical_ms): Latency in ms that triggers a critical alert. - Down Severity: Alert severity when the monitor goes down (default: critical).
- Degraded Severity: Alert severity when the monitor is degraded (default: warning).
- Auto-Resolve: Automatically resolve alerts when the monitor recovers (default: enabled).
- Enabled: Whether the monitor is actively running checks.
- Muted: Whether alerts are suppressed for this monitor.
- Description: Free-text field for documenting what the monitor checks.
- Labels: Key-value pairs for filtering and organizing monitors.
- Group: Assign the monitor to a monitor group.
- Service: Link the monitor to a service in the service catalog.
- Escalation Policy: Which policy to trigger when the monitor enters the Down state.
- Runbook URL: Link to the runbook for this monitor (shown in notifications).
Status States
Section titled “Status States”A monitor is always in one of three built-in states:
| State | Meaning |
|---|---|
| Up | All checks are passing. |
| Down | The confirmation threshold has been reached. |
| Degraded | The check is responding but with elevated latency or partial failures. |
Beyond these built-in states, you can define custom monitor states for your organization. Each custom state has a name, health class (healthy, degraded, or unhealthy), severity, and color. See Custom Monitor States for details.
Match Rules
Section titled “Match Rules”Match rules let you map specific HTTP response conditions to custom states on a per-monitor basis. Each rule evaluates conditions such as status code (exact or range), body content (case-sensitive substring match), or response headers. Rules are ordered, and the first matching rule wins.
Configure match rules in the monitor edit form under the Match Rules section.
Labels
Section titled “Labels”Labels are key-value pairs you can attach to any monitor for filtering and organizing. Add labels in the monitor creation or edit form. Once applied, use the label bar on the monitor list page to filter monitors by label.
Auto-Resolve
Section titled “Auto-Resolve”When auto-resolve is enabled on a monitor, any alert triggered by that monitor will automatically resolve when the monitor recovers to a healthy state. This is enabled by default and can be toggled per monitor.
Monitor Groups
Section titled “Monitor Groups”You can group related monitors together for a composite rollup status view. The group’s status reflects the worst status among its child monitors. See Monitor Groups for details.
Setup Guide
Section titled “Setup Guide”- Navigate to Monitors in the sidebar.
- Click New Monitor and select a monitor type (HTTP, TCP, DNS, Ping, or Heartbeat).
- Fill in the type-specific fields (URL, hostname, port, etc.).
- Configure the check interval, timeout, and latency thresholds.
- Assign an escalation policy to define who gets notified on failure.
- Click Save to activate the monitor.
Rate Limits
Section titled “Rate Limits”The Free plan supports up to 5 monitors with a minimum interval of 300 seconds. Pro supports up to 500 monitors with 30-second intervals. Enterprise supports unlimited monitors with 10-second intervals.