Quick Start
This guide walks you through the basics: signing up, creating a monitor, connecting a notification channel, and wiring everything together with an escalation policy.
1. Sign Up
Section titled “1. Sign Up”Visit console.yipyap.run/register and create an account. The Free plan includes up to 5 monitors with 5-minute check intervals.
2. Create Your First Monitor
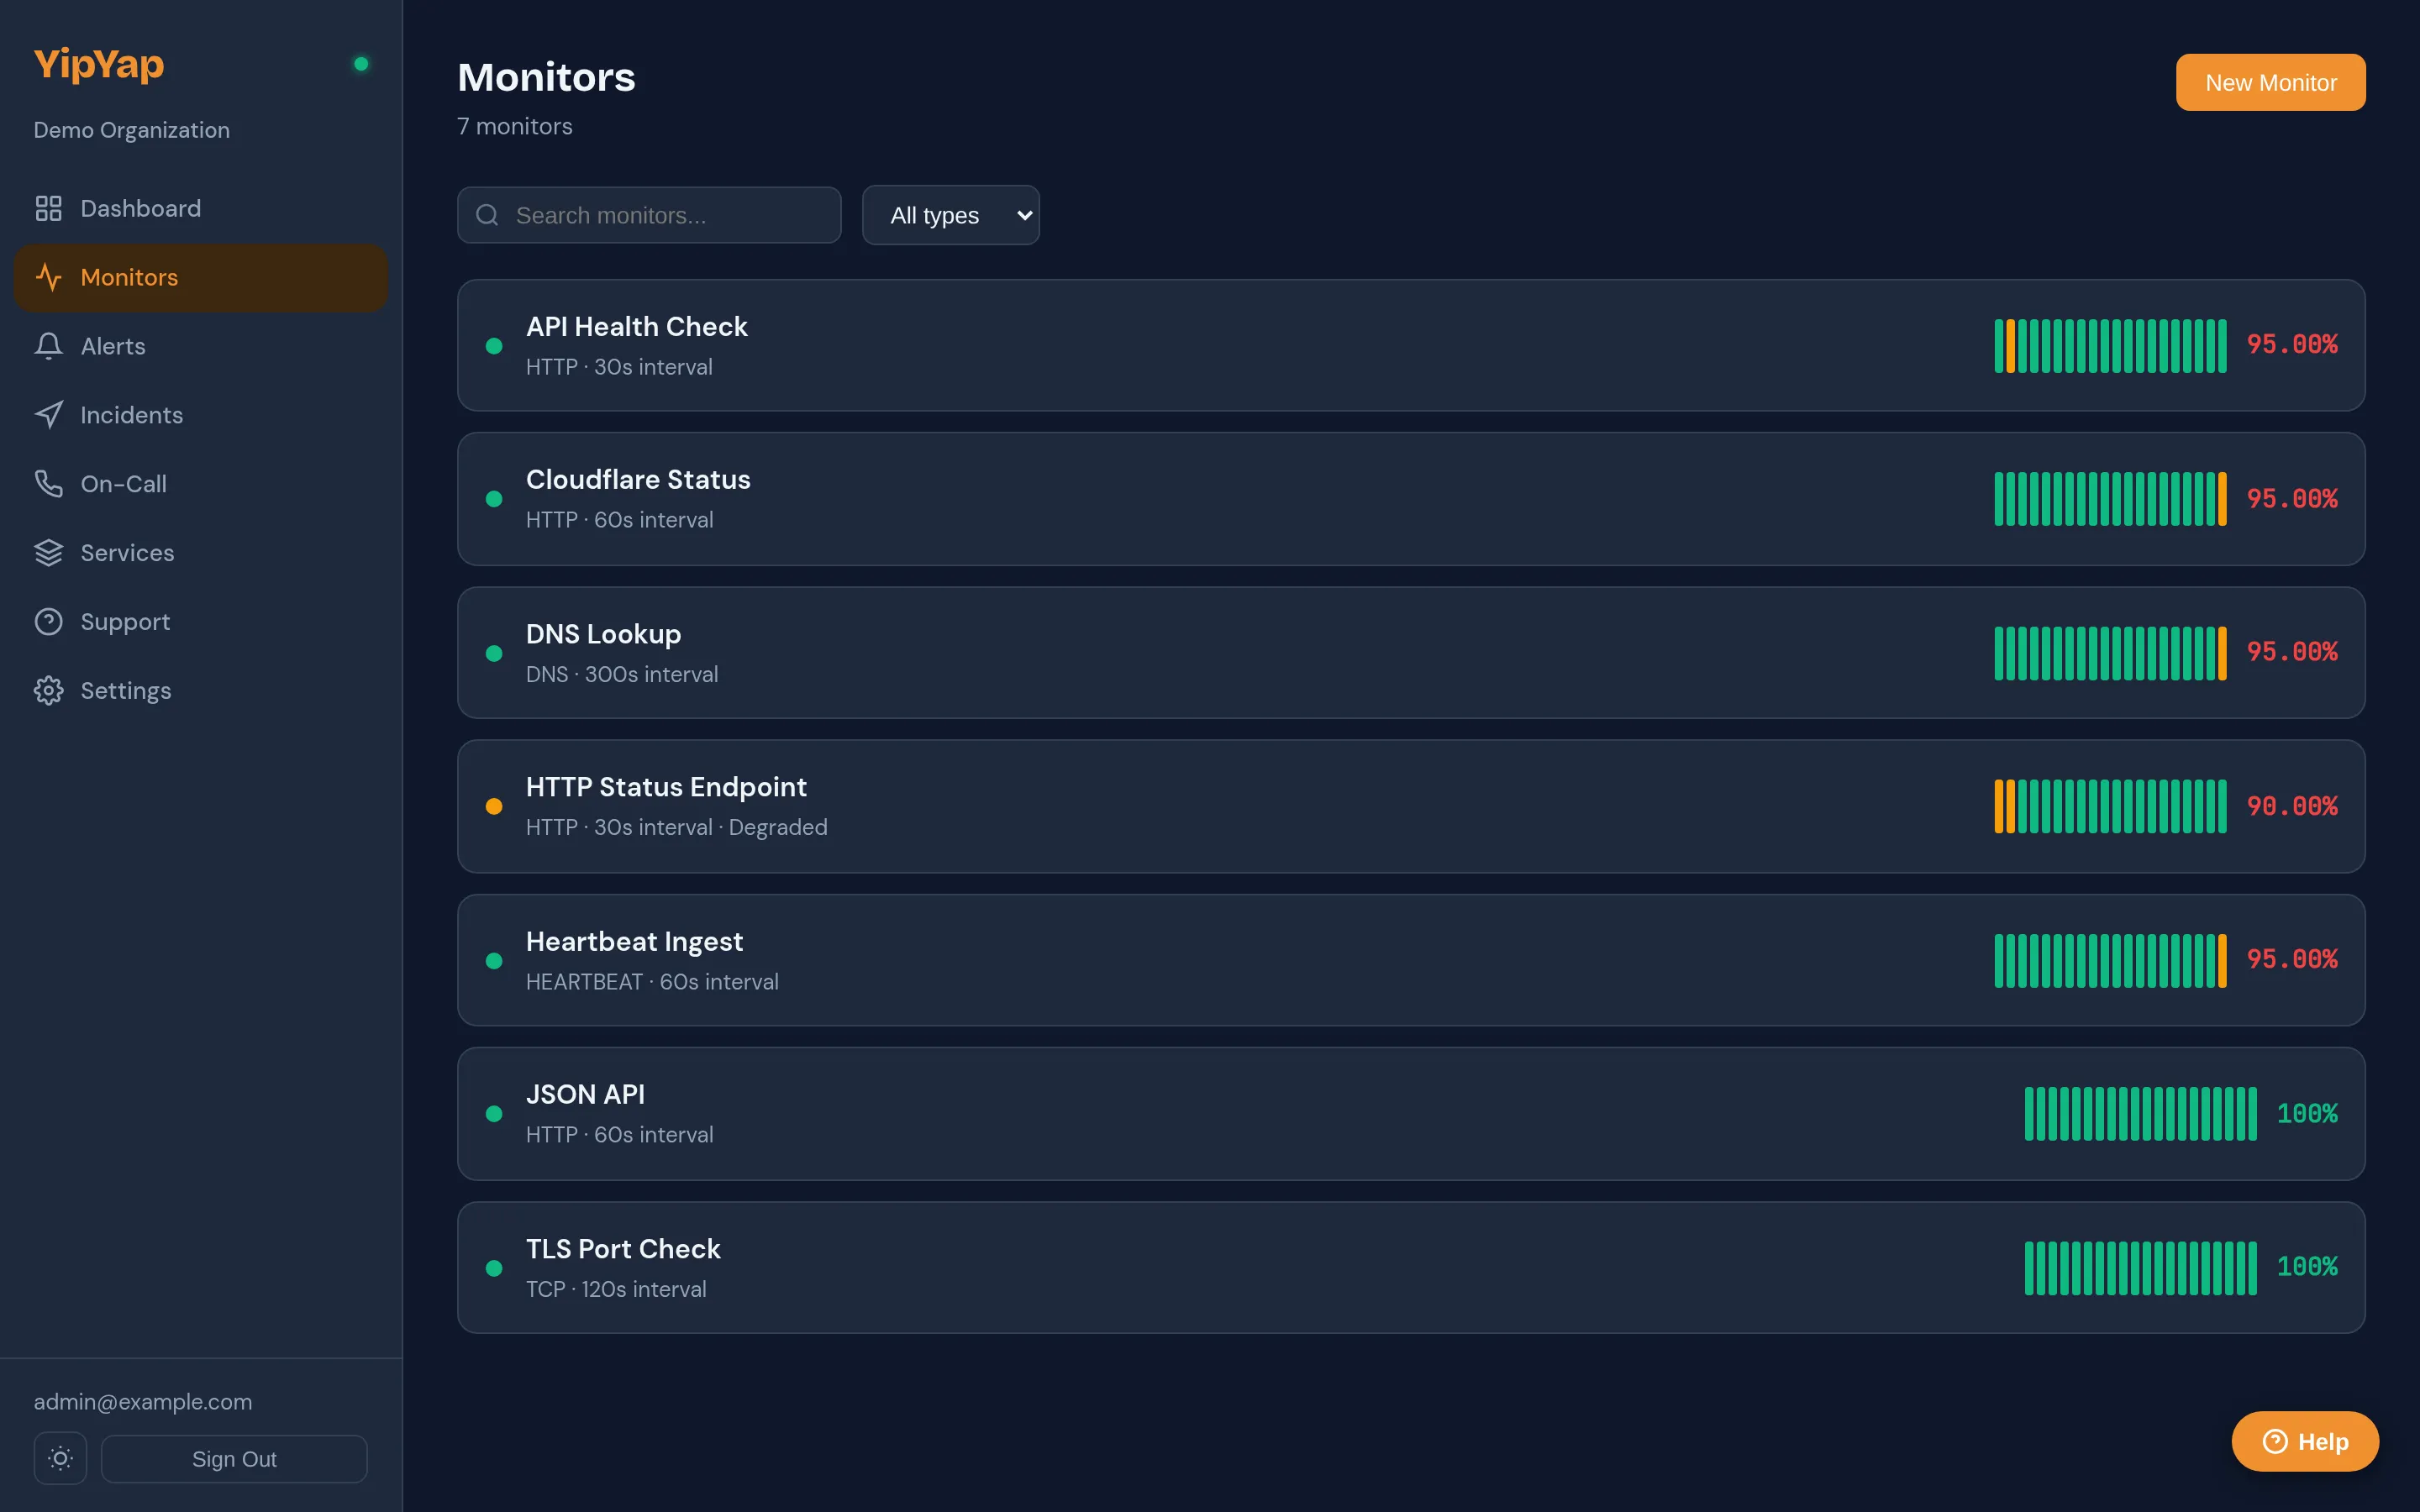
Section titled “2. Create Your First Monitor”- Navigate to Monitors in the sidebar.
- Click New Monitor.
- Choose HTTP as the check type.
- Enter the URL you want to monitor (e.g.
https://api.example.com/health). - Set the check interval. Free plans start at 300 seconds (5 minutes); Pro allows intervals as low as 30 seconds.
- Set the confirmation threshold to 2 (the monitor must fail twice before firing an alert).
- Click Save.
Your monitor will begin checking immediately. The dashboard shows real-time status, latency, and uptime percentage.
3. Connect a Notification Channel
Section titled “3. Connect a Notification Channel”- Go to Settings > Notifications.
- Click Add Channel.
- Select your preferred channel type (Slack, Discord, email, etc.).
- Follow the setup instructions for that channel. For Slack, you will install the YipYap bot app. For email, you will configure SMTP credentials.
- Send a test notification to confirm delivery.
4. Create an Escalation Policy
Section titled “4. Create an Escalation Policy”- Navigate to Alerting > Escalation Policies.
- Click New Policy.
- Add a first step: select the notification channel you just created.
- Optionally add a second step with a different channel or user, and set a wait time (e.g. 5 minutes).
- Enable Loop if you want the policy to repeat until the alert is acknowledged.
- Click Save.
5. Assign the Policy to Your Monitor
Section titled “5. Assign the Policy to Your Monitor”- Open your monitor’s settings.
- Under Escalation Policy, select the policy you just created.
- Save.
That is it. When your endpoint goes down, YipYap will detect the failure, fire an alert, and notify you through your configured channels following the escalation steps you defined.
What to Explore Next
Section titled “What to Explore Next”- Monitor types for TCP, DNS, Ping, and Heartbeat checks
- On-call schedules for rotating who receives alerts
- Status pages for sharing uptime with your users